-
Solutions
Solutions
Explore SciBite’s full suite of solutions to unlock the potential of your data.
-
Use Cases
Use Cases
Discover how SciBite’s powerful solutions are supporting scientists and researchers.
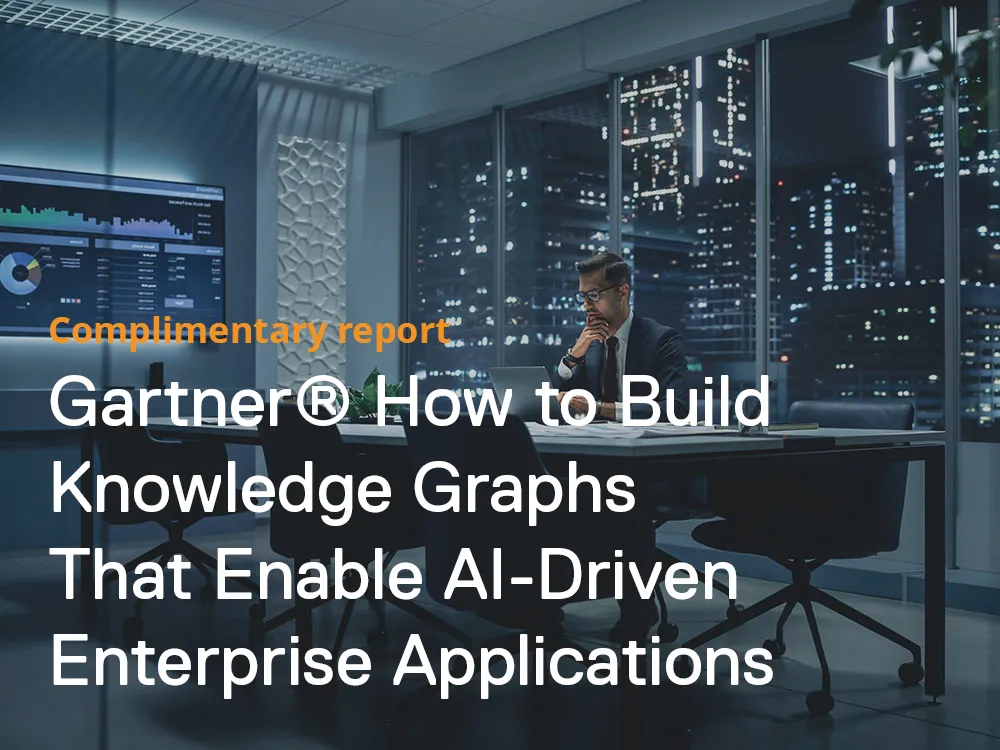
Gartner reportGartner® How to Build Knowledge Graphs That Enable AI-Driven Enterprise Applications
-
Knowledge Hub
Resources
Discover our whitepapers, spec sheets, and webinars for in-depth product knowledge.
Ctrl Alt Tech PodcastWhere technology meets curiosity. In each episode, we chat with expert guests to explore a wide range of STEM topics.
-
About
About SciBite
Explore SciBite’s full suite of solutions to unlock the potential of your data.
Explore SciBite’s full suite of solutions to unlock the potential of your data.
Discover how SciBite’s powerful solutions are supporting scientists and researchers.
Gartner® How to Build Knowledge Graphs That Enable AI-Driven Enterprise Applications
Discover our whitepapers, spec sheets, and webinars for in-depth product knowledge.
Where technology meets curiosity. In each episode, we chat with expert guests to explore a wide range of STEM topics.
Explore SciBite’s full suite of solutions to unlock the potential of your data.