Use Cases

Discover how SciBite’s powerful solutions are supporting scientists and researchers.

Use Cases Overview

Gartner report

Gartner® How to calculate business value and cost for generative AI use cases

Access report

Knowledge Hub

Explore expert insights, articles, and thought leadership on scientific data challenges.

Knowledge Hub

Resources

Discover our whitepapers, spec sheets, and webinars for in-depth product knowledge.

Resources

Events

Join us at upcoming events and webinars to learn more about SciBite solutions.

Events

News

Stay informed with the latest SciBite updates, announcements, and industry news.

News

About SciBite

Explore SciBite’s full suite of solutions to unlock the potential of your data.

Discover more about us

Our Partners

We build powerful partnerships with world-leading organizations.

Our Partners

What is a semantic knowledge graph?

At a time where more and more of our customer projects revolve around knowledge graph creation, we thought it was about time we blogged on what exactly a knowledge graph is and explain a bit more about how our semantic enrichment technology is being used to facilitate the production of such a powerful data model.

The term knowledge graph was first introduced by Google in 2012. If you have ever completed a search using the engine (which you almost certainly have!) then you have consumed data served by a knowledge graph; it’s the underlying graph structure that populates the box on the right hand side of the results page. Google’s knowledge graph harmonizes data from a number of public sources to provide a comprehensive summary of the query entity. Other large technology companies also make use of this data representation, including Facebook’s social network and the Amazon product graph. This is all very well, but it still doesn’t provide us with an answer to what exactly is a knowledge graph?

What is a Semantic Knowledge Graph?

In an oh-so common scenario within the field of technology, there exists a plethora of definitions to describe a knowledge graph. These definitions not only range in clarity and complexity but are used interchangeably and are often only meaningful to the area of application. A safe and simple definition of a knowledge graph that we use is…

a semantic graph that integrates information into an ontology

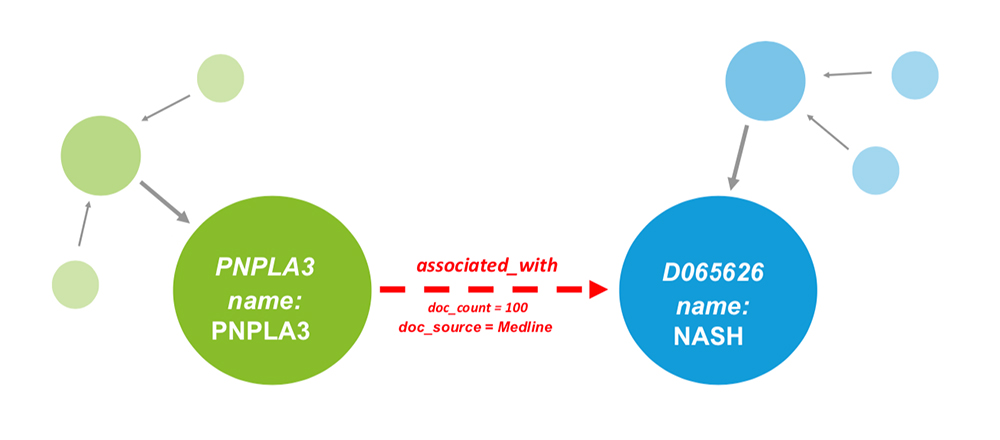
In a graph representation, entities or ‘things’ are represented as nodes, or vertices, with associations between these nodes captured as edges, or relationships. Furthermore, nodes and edges may hold attributes that describe their characteristics (see Fig 1.).

The fact that a knowledge graph is semantically enriched means that there is meaning associated to the entities in the graph, i.e. they are aligned to ontologies. For example, a node that has the name NASH is pretty meaningless in and of itself. To a scientifically knowledgeable human it may be clear that this node refers to a disease, but how would a computer assign a type to this node; is it a gene, a drug or even a person?

Furthermore, which other nodes this may interact with and via what type of edge? A knowledge graph gets around this by labelling the NASH node as a disease; by aligning this node to a disease ontology a computer can start to understand that entity in the context of other node types that may also be in the knowledge graph. Simply put, a knowledge graph understands real-world entities and their relationships to one another: things, not strings.

If we also have genes in the graph we can add edges between diseases and genes that describe associations in the form GENE -> associated with -> DISEASE (see Fig 1.). Read more in our use case on using phenotype triangulation to improve disease understanding.

Figure 1: Visualization of a knowledge graph. Nodes are represented as circles and edges as arrows, with attributes allowed on either. Entities are captured in ontologies, with green nodes representing genes and blue nodes representing indications

A Semantic Knowledge Graph: power of data representation in graph format

Ok, so we now have a definition of a knowledge graph but what makes this data representation so powerful?

A knowledge graph can be used to connect data from numerous heterogeneous data silos, whether they are external or internal, provided entities are harmonized to common identifiers – something we will touch on shortly! Unlike more restrictive relational databases, graphs allow for the creation of typed relationships with attributes attached in a lot more intuitive a representation than foreign keys or join tables. Graphs don’t rely on prohibitive schema and can be updated and modified as and when required, as a project evolves.

Furthermore, when aligning data in your graph to ontologies, as well as the semantics, you also get the metadata captured in the ontology for free. Finally, once your data has been integrated into a single view, inferences that would have been otherwise unseen can be made. We have also seen in recent years that the technology supporting knowledge graphs has matured and, importantly, is scalable. Graph databases, with intuitive query abilities, have reduced the barrier for entry for those interested in knowledge graphs dramatically.

In order to get the most out of your knowledge graph it’s important to understand the use case you are trying to address from the offset. Typically speaking, there are 2 approaches to creating knowledge graphs, at an enterprise level for search, or at a project level to enable inferences.

An enterprise knowledge graph will, by definition, be more abstract, including data from many departments in a company, e.g. finance, HR, legal, R&D etc, where everybody is viewing the data from a different aspect, or through a particular lens.

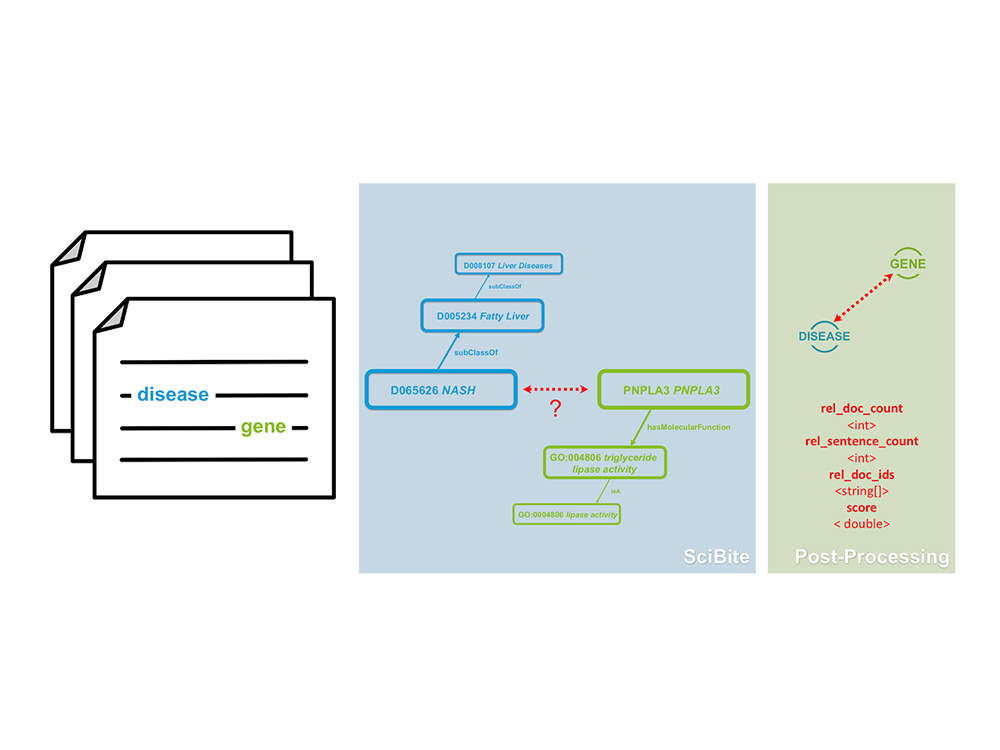
Figure 2: Extracting semantic triples for textual data using. SciBite can extract semantic triples from text and align these entities to their extensive set of ontologies. Once aligned this data can be effortlessly ingested into any knowledge graph

How can SciBite use semantics to help facilitate the production of knowledge graphs?

We have described what a knowledge graph is, what makes a knowledge graph so powerful and the importance of identifying a use-case, but what can we at SciBite do to help facilitate the production of these I hear you ask! This facilitation can be broken down into 3 areas…

  1. Ontologies – As ontologies provide the backbone to any knowledge graph effort there is no surprise that this comes first in our list! SciBite has an extensive set of ontologies covering over 120 life science entity types, including gene, drug, disease to name but a few. Furthermore, SciBite also has tooling to create, extend, merge, and manage such ontologies.
  2. Harmonization of datasets – as mentioned above, the ability to create knowledge graphs hinges on the ability to harmonize, or integrate, data from multiple sources. For example, if one dataset refers to NASH as ‘Non-alcoholic steatohepatitis’ and the other as ‘NASH’ how do we align these to the single MESH identifier D065626? This is where SciBite comes in. Our ability to align entities to single IDs captured in our ontologies allows structured data to seamlessly be ‘cleaned’ and integrated, whether that be from internal or external data sources.
  3. Extraction of triples from textual data – SciBite can extract semantic triples from text and align these entities to their extensive set of ontologies. Once aligned this data can be effortlessly ingested into any knowledge graph alongside any other structured datasets (see Fig. 2).

The above functionalities provide the basic ingredients required for a knowledge graph pipeline. By knitting the pieces together in a connected workflow, you can start to see how SciBite can support the creation of ontologies while also harmonizing and integrating data from both unstructured and structured data sources; aligning such data to the supporting ontologies. Such a pipeline could be semi-automated or even automated, depending on the use case.

The great news is SciBite’s knowledge graph facilitation with data harmonization/extraction is completely agnostic to the technology you wish to use to represent or indeed store your knowledge graph. So whether you are an RDF expert (check out our blog on SciBite & RDF – A natural semantic fit) looking at triplestores supporting SPARQL endpoints or more interested in the ease that comes with LPGs and the more intuitive graph query languages that come with these, SciBite can help you…

Joe Mullen
Director of Data Science & Professional Services, SciBite

Leading SciBite’s data science and professional services team, Joe is dedicated to helping customers unlock the full potential of their data using SciBite’s semantic stack. Spearheading R&D initiatives within the team and pushing the boundaries of the possible. Joe’s expertise is rooted in a PhD from Newcastle University, focussing on novel computational approaches to drug repositioning; building atop semantic data integration, knowledge graph & data mining.

Since joining SciBite in 2017, Joe has been enthused by the rapid advancements in technology, particularly within AI. Recognizing the immense potential of AI, Joe combines this cutting-edge technology with SciBite’s core technologies to craft tailored, bespoke solutions that cater to diverse customer needs.

Other articles by Joe

  1. Are ontologies still relevant in the age of LLMs? read more
  2. What is Retrieval Augmented Generation, and why is the data you feed it so important? read more
  3. Large language models (LLMs) and search; it’s a FAIR game, read more
  4. Revolutionizing Life Sciences: The incredible impact of AI in Life Science [Part 1], read more
  5. Why use your ontology management platform as a central ontology server? read more
Share this article
Relevant resources, events and news