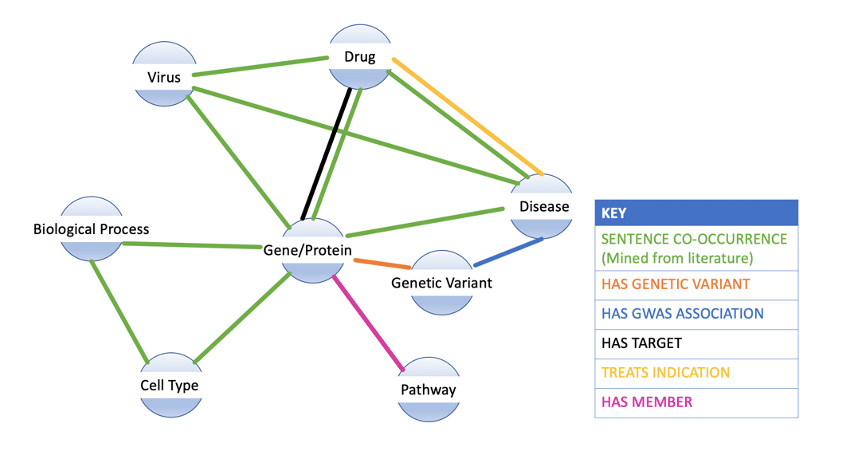
“Do you have a pre-made knowledge graph covering biomedical literature?” is a question we often hear at SciBite. The answer is yes we do, and in this blog post we’ll describe what our SciBite knowledge graph is, its content and the types of questions it can answer.
We’ll also cover the limitations of general, large-scale knowledge graphs and how these can be overcome with the SciBite platform.
Knowledge graphs are an exciting technology that allows both humans and computers to explore concept-to-concept relationships across an entire domain.
In biomedicine, knowledge graphs help researchers and clinicians understand the interconnectivity between genes, diseases, drugs, side effects, processes and many more components of complex physiological networks. It’s a subject we’ve written about quite a lot already and something we work on with our customers on a daily basis. SciBite’s ontology management tool, CENtree and our named entity recognition engine TERMite, are key components in any knowledge graph pipeline, providing the essential mechanism to unambiguously define the core components of the network.
How did we go about creating the SciBite Knowledge Graph? We annotated the entirety of biomedical literature with our extensive, highly curated vocabularies that contain many critical biological concepts using TERMite. In total, approximately half a million entities were annotated across the corpus, providing billions of relationships between them.
To sanitize the data and make it more consumable, we processed all of these relationships to generate over 7.5 million, high-quality, unique pairs that describe the nature of the association between the two entities. We then incorporated additional structured data sources of pre-annotated, human-curated data to augment the graph. The data was produced using a custom Python-based workflow and the system has been implemented into Neo4j.
It is worth noting that SciBite is platform-agnostic when it comes to knowledge graphs. The result is a deep, but easily consumable map of the many networks in human biology.
Comprehensive graphs can be used to answer a broad range of questions, for instance a common challenge within early drug discovery is:
“We have an approved compound with target X. We want to prioritise new indications as repurposing candidates.”
Let’s look at how the graph can provide a starting point to answer this using the protein Histone deacetylase 3 (HDAC3) as an example.
1. What HDCA3 inhibitors do we already know about?
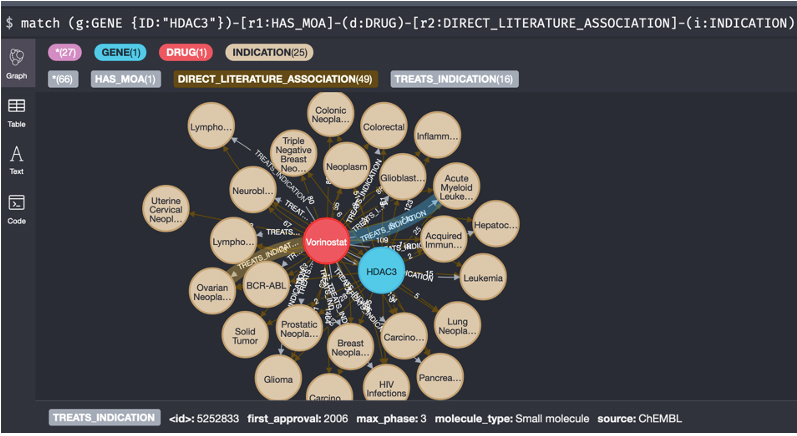
We start with the HDAC3 node in the graph and expand out to identify therapeutic agents connected. The image below shows two examples, Vorinostat and Mocetinostat, which are related by both literature text-analytics data and direct Mechanism of Action relationships from the ChEMBL database.
2. What indications are these known to treat?
Next, we can expand out each drug to get a better understanding of the indications those drugs are used to treat. These will likely include competitor drugs, giving us a full picture of the current therapeutic uses of HDAC3 inhibitors.
By combining the data across all HDAC3 drugs, we gain invaluable insight into the current state of this target within the industry. The example here looks at both direct evidence from public databases and the biomedical literature but (as described below) could easily be expanded to include commercial competitor intelligence data.
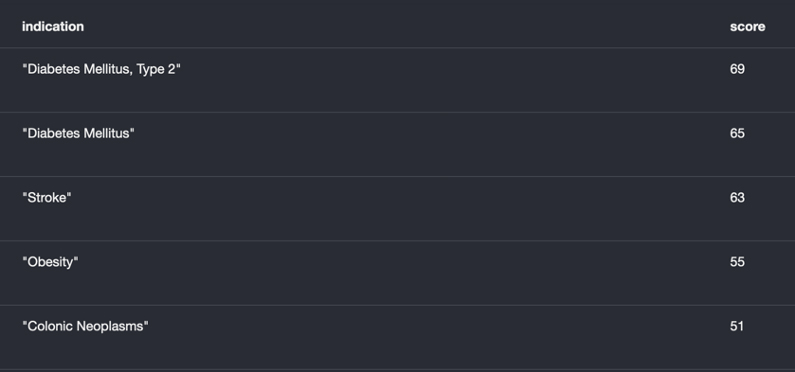
3. Give me a list of indication associations from the literature which are not in the known treatments list for HDAC3 inhibitors?
Finally, we would like to explore diseases linked to HDAC3 which are not in the set of known drug treatments, opening up the way to new repurposing opportunities. In this example, we’ve exported the data as a list that can perhaps be loaded into other tools or post-processed (e.g., against genetic data), but the data comes from the same graph.
All of these examples are generated by using simple queries of the graph (using the Cypher query language) or visual exploration, suiting both inquisitive lab scientists as well as bioinformatics and data science professionals. Many more use-cases can be served by the same graph; take a look at our previous blog and our recent webinar on creating knowledge graphs from literature for more examples.
While the SciBite Knowledge Graph represents a deep, structured map of biomedical data useful for rapidly investigating key biological networks, it can never be the answer to every question. Most critically, generic knowledge graphs likely miss key data or sources that cover the domain of interest to a user. This means many users will be querying graphs that often don’t hold the data to answer their questions. For many situations, a more tailored knowledge graph is required, based on the following key elements:
These reasons are why many of our customers choose SciBite as part of their data science efforts, allowing them to create bespoke knowledge graphs facilitated by our FAIR-based data integration pipelines. There is still a great deal of value in using the SciBite Knowledge Graph to provide a foundational dataset covering core biomedical relationships, to which more specific nodes and edges are added. In summary, SciBite gives you the best of both worlds, a comprehensive infrastructure for knowledge graphs by providing:
The SciBite Knowledge Graph is a system that gives you instant access to the world’s biomedical knowledge, and the tools to add your own proprietary insights. It’s available exclusively to our customers so if you are actively working with this area and would like to access to our online demo, please get in touch with the team today. You can also read more about our expertise in Knowledge Graphs.
Leading SciBite’s data science and professional services team, Joe is dedicated to helping customers unlock the full potential of their data using SciBite’s semantic stack. Spearheading R&D initiatives within the team and pushing the boundaries of the possible. Joe’s expertise is rooted in a PhD from Newcastle University, focussing on novel computational approaches to drug repositioning; building atop semantic data integration, knowledge graph & data mining.
Since joining SciBite in 2017, Joe has been enthused by the rapid advancements in technology, particularly within AI. Recognizing the immense potential of AI, Joe combines this cutting-edge technology with SciBite’s core technologies to craft tailored, bespoke solutions that cater to diverse customer needs.
Other articles by Joe