Use Cases

Discover how SciBite’s powerful solutions are supporting scientists and researchers.

Use Cases Overview

Gartner report

Gartner® How to calculate business value and cost for generative AI use cases

Access report

Knowledge Hub

Explore expert insights, articles, and thought leadership on scientific data challenges.

Knowledge Hub

Resources

Discover our whitepapers, spec sheets, and webinars for in-depth product knowledge.

Resources

Events

Join us at upcoming events and webinars to learn more about SciBite solutions.

Events

News

Stay informed with the latest SciBite updates, announcements, and industry news.

News

About SciBite

Explore SciBite’s full suite of solutions to unlock the potential of your data.
Discover more about us

Our Partners

We build powerful partnerships with world-leading organizations.

Our Partners

Addressing common challenges with knowledge graphs
In this blog we describe the pivotal role of semantic enrichment in the creation of effective Knowledge Graphs, and illustrate how semantic Knowledge Graphs help answer complex scientific questions.

A typical Knowledge Graph scenario

In our previous blog ‘What is a Knowledge Graph‘ we described what a knowledge graph is, what makes them so powerful and how they can be applied to both specific projects as well as at the enterprise level. We also touched on a few of the ways in which our text analytics and semantic enrichment can help with their creation.

In this blog we’re going to expand on this, using the following scenario:

Identifying a set of targets associated with Type II Diabetes and prioritizing those not already targeted by an existing drug based on their tissue expression profile.

To answer this question we need a holistic view across multiple data sources including:

  • Unstructured public literature sources, such as MEDLINE to identify:
    • targets mentioned in the same article as Type II Diabetes, and
    • biological processes associated with those targets.
  • Structured public sources, such as ChEMBL, to check if a target is already targeted by a marketed drug.
  • Structured internal sources, such bioassays databases, to understand the expression profile of the target.

Learn more about how our technology facilitates the production of knowledge graphs.

Visualizing entities and relationships

As illustrated below, a knowledge graph provides a simple and intuitive way to visualize the question by representing the different entities involved and the relationships between them. Once the relationships between data are made in this way, it becomes easier to ask questions and make inferences that would otherwise remain unseen.

Figure 1: A visual representation of the relationships between a selection of scientific entities

However, building a knowledge graph is not as easy as just pulling data together. Before the graph can be created, there are several important steps to undertake:

  • Aligning data with standards
  • Harmonisation of datasets
  • Extracting relations from the data
  • Generating the Schema

Aligning data with standards

As we mentioned in our previous blog, a simple definition of a knowledge graph is “a semantic graph that integrates information into an ontology”. Ontologies are the foundation of any knowledge graph – they give explicit meaning to terms found in the scientific text and encapsulate the relationships between them.

By curating unstructured scientific text with ontologies, also known as semantic enrichment, it can be contextualised so that it describes “things, not strings”[1] and can be understood and used by computers. So, for example, a computer can understand that the term ‘NIDDM’ is not a random string of letters but refers to an indication.

We provide an extensive range of ontologies, known as VOCabs, comprising tens of millions of synonyms for more than 120 life science entity types, including gene, drug and disease. Each VOCab is enhanced by a combination of our experienced manual curation team and our proprietary ontology enrichment software to provide unrivalled coverage of many more topics and in far greater depth than publicly available ontologies, such as MeSH and MeDDRA.

But we’re by no means limited to existing VOCabs: our ontology management platform CENtree provides a centralised resource for ontology management and enables users to extend VOCabs, manage internal vocabularies, such as compound IDs and study codes, or develop new ontologies for domains not currently captured in a VOCab. CENtree also leverages  Machine Learning techniques to suggest new ontological candidates when building and extending vocabularies.

Harmonization of datasets

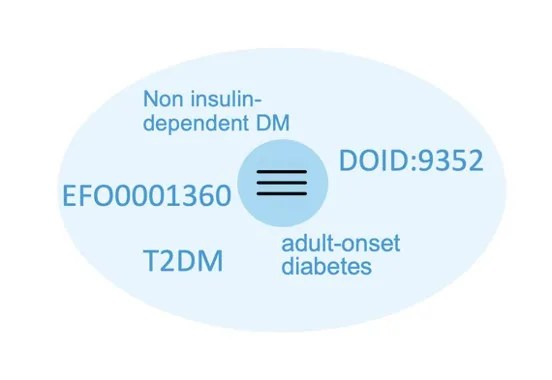
The ability to create semantic knowledge graphs is critically dependent on the ability to Harmonize, or integrate, data from multiple sources. However, a common issue in both public and internal scientific sources is that different authors use different names to describe the same thing. As a consequence, searching for the Type II Diabetes-related gene, ABCC8, would miss references to synonyms such as ‘SUR1’, ‘MRP8’ and ‘ATP-binding cassette, sub-family C, member 8’.

When coupled with VOCabs, our Named Entity Recognition (NER) engine, TERMite, enables the rapid identification of scientific entities within unstructured text, regardless of the synonym used by the author. TERMite aligns these entities to single unique identifiers captured in our ontologies, resulting in ‘clean’, structured data that can be integrated with other sources.

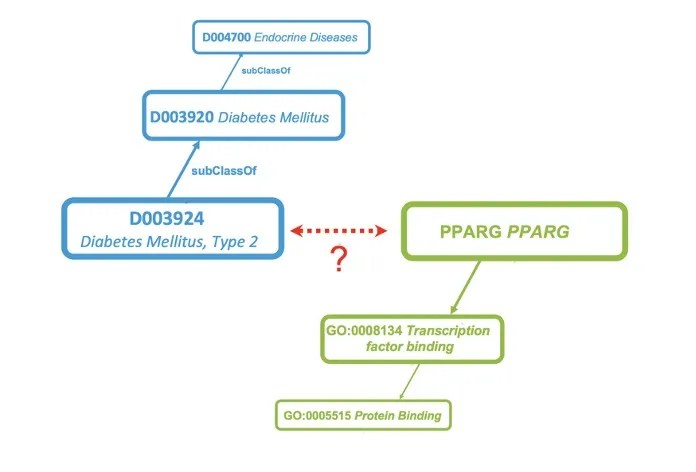
But ontologies deliver much more than data harmonization. One of the roles of an ontology is to provide a common model of knowledge associated with a given domain so, for example, the fact that Type II Diabetes Mellitus is an endocrine disease is already encapsulated within the ontology that is used to enrich the source text.

Figure 2: A selection of the many synonyms for the Type II Diabetes-related gene, ABCC8

When coupled with VOCabs, our Named Entity Recognition (NER) engine, TERMite, enables the rapid identification of scientific entities within unstructured text, regardless of the synonym used by the author. TERMite aligns these entities to single unique identifiers captured in our ontologies, resulting in ‘clean’, structured data that can be integrated with other sources.

But ontologies deliver much more than data harmonisation. One of the roles of an ontology is to provide a common model of knowledge associated with a given domain so, for example, the fact that Type II Diabetes Mellitus is an endocrine disease is already encapsulated within the ontology that is used to enrich the source text.

Once a disease entity has been harmonised to a single ID, such as the MeSH ID, it makes it possible to map it to other representations of the disease from other ontologies such as EFO (Experimental Factor Ontology), OMIM (Online Mendelian Inheritance in Man), or SNOMED (Systematized Nomenclature of Medicine). This enables information found in the literature to be augmented with additional information from other structured data sources. For example to find drugs used to treat that indication from ChEMBL or to identify genes associated with the indication of interest from OpenTargets. Essentially these linkages provide a ‘springboard’ for further exploration across the graph.

Extracting relations from data

Once data has been harmonised, the next challenge is to Extract Relations from the literature. The goal of this stage is to identify when a specific association exists between two entities rather than when they are simply just being mentioned in the same document.

To identify such relationships, we can define semantic patterns, or groups of patterns (something we call ‘bundles’), which describe a relationship between two concepts, such as a gene and drug, in the form Gene-Verb-Drug. We then use TExpress to extract them from the text as semantic triples, aligned to ontologies.

But some relationships are more ambiguous. Adverse events are a great example of this: does the mention of a drug and an indication indicate a treatment or a causal relationship. Drugs can treat a headache but also cause one – context is everything! We have a lot of experience in solving this kind of problem. Machine Learning models can be trained with the curated output from TExpress to help identify relationships in specific contexts.

Figure 3: Extracting evidence from unstructured text to support linkages between disease and target entities

To identify such relationships, we can define semantic patterns, or groups of patterns (something we call ‘bundles’), which describe a relationship between two concepts, such as a gene and drug, in the form Gene-Verb-Drug. We then use TExpress to extract them from the text as semantic triples, aligned to ontologies.

But some relationships are more ambiguous. Adverse events are a great example of this: does the mention of a drug and an indication indicate a treatment or a causal relationship. Drugs can treat a headache but also cause one – context is everything! We have a lot of experience in solving this kind of problem. Machine Learning models can be trained with the curated output from TExpress to help identify relationships in specific contexts.

Ultimately, this generates a set of the various attributes that describe a relationship or association which can be ingested into, and subsequently enrich, a knowledge graph.

Generating the schema

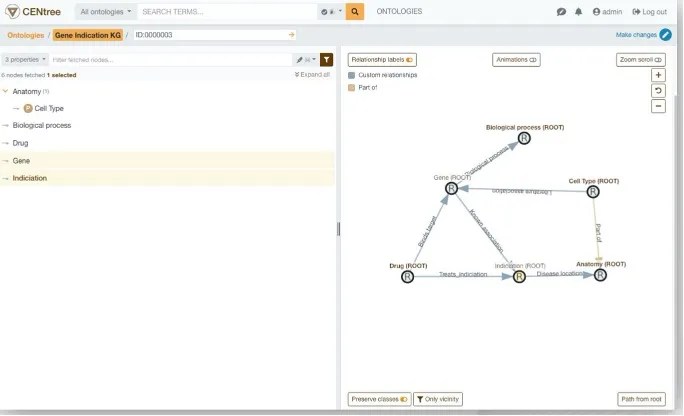
The final aspect to consider is Schema Generation – the creation of a high level meta graph of the relevant entities and the relationships between them. CENtree can be used to create a simple representation using an initial ‘bridging ontology’ which can then be enriched with more ontologies, such as a disease entity populated by EFO disease classification.

Once the schema has been generated, CENtree enables you to export it to your graph database of choice in whatever format suits your particular application. For example, if you are generating an enterprise graph to hold large, normalised datasets from across your organisation that can be retrieved by other systems, then the schema can be exported to an RDF Triplestore.

Whereas if your graph is designed to support investigative analytics as part of a target validation or drug repositioning initiative, then you’ll probably want to export your schema in JSON format so it can be ingested into a more intuitive labelled property graph. Whatever your application, our consultants are experienced with technologies such as Stardog and Neo4J and can help you identify the best tool for the job.

Figure 4: A meta graph representation in CENtree

Using semantic Knowledge Graphs to answer complex scientific questions

We’ve described four important aspects of building a knowledge graph where our semantic technologies can help. But they don’t need to be used in isolation. Our technologies are provided as easy-to-consume microservices which can be easily embedded into an automated knowledge graph creation pipeline.

Let’s conclude by returning to our original question: identify and prioritise a set targets that are associated with Type II Diabetes. Consider for a moment how long it would take you to answer it without a knowledge graph – I think we can all agree it would take hours or even days to collate the relevant data and marry up information from the various disconnected data sources.

By contrast, semantic knowledge graphs provide a single entry point that can be queried and iteratively filtered to answer this type of question. For example, in the image below, the outer green ring represents all GENE-INDICATION associations with sentence co-occurrence found in MEDLINE, and each inner ring represents an additional filter/criteria being addressed

Figure 5: Iterative filtering of the knowledge graph enables researchers to rapidly focus on the most promising candidate targets

This approach enables users to reduce their search space from thousands of potential targets to a handful of high priority candidates in just a matter of seconds and significantly speed up the process of innovation. And as we’ve seen, our semantic technologies play a pivotal role in facilitating each of the main activities involved in the construction of such knowledge graphs: enabling data to be aligned with standards and harmonised as well as extracting relations from the data and ultimately supporting the generation of the schema to generate an integrated network from both unstructured literature and structured data sources.

This approach enables users to reduce their search space from thousands of potential targets to a handful of high priority candidates in just a matter of seconds and significantly speed up the process of innovation. And as we’ve seen, our semantic technologies play a pivotal role in facilitating each of the main activities involved in the construction of such knowledge graphs: enabling data to be aligned with standards and harmonised as well as extracting relations from the data and ultimately supporting the generation of the schema to generate an integrated network from both unstructured literature and structured data sources.

Read more about how our technology facilitates the production of knowledge graphs.

Joe Mullen
Director of Data Science & Professional Services, SciBite

Leading SciBite’s data science and professional services team, Joe is dedicated to helping customers unlock the full potential of their data using SciBite’s semantic stack. Spearheading R&D initiatives within the team and pushing the boundaries of the possible. Joe’s expertise is rooted in a PhD from Newcastle University, focussing on novel computational approaches to drug repositioning; building atop semantic data integration, knowledge graph & data mining.

Since joining SciBite in 2017, Joe has been enthused by the rapid advancements in technology, particularly within AI. Recognizing the immense potential of AI, Joe combines this cutting-edge technology with SciBite’s core technologies to craft tailored, bespoke solutions that cater to diverse customer needs.

Other articles by Joe

  1. Are ontologies still relevant in the age of LLMs? read more
  2. What is Retrieval Augmented Generation, and why is the data you feed it so important? read more
  3. Large language models (LLMs) and search; it’s a FAIR game, read more
  4. Revolutionizing Life Sciences: The incredible impact of AI in Life Science [Part 1], read more
  5. Why use your ontology management platform as a central ontology server? read more
Share this article
Relevant resources, events and news