The Relationship Game – Knowledge Graphs
Scientific knowledge can be represented as relationships between things. Thousands or millions of such relationships make a knowledge graph or network analysis. SciBite technology enables extraction of these relationships, and in doing so, can uncover knowledge that might otherwise have remained hidden
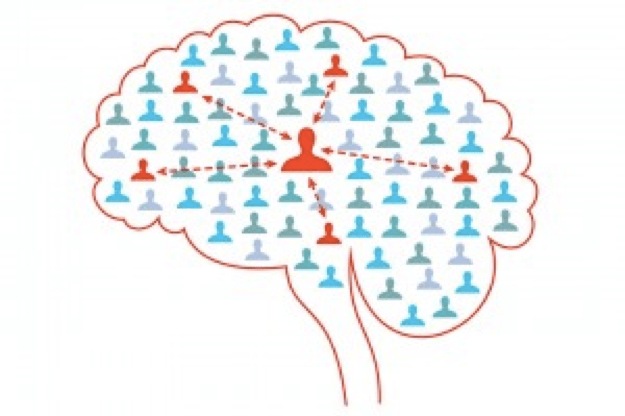
“Graphs are the most efficient and natural way of working with data. They are deeply intuitive, and mimic the interconnectedness of concepts and ideas in the human mind.”
— neo4j.com
Six Degrees
Network theory collided with popular culture following the invention of the “Six degrees of Kevin Bacon” game, where the idea is that everyone in the world is no more than 6 acquaintance links apart. This is epitomised by the network of actors Kevin Bacon has worked with during his film career. Following the advent of social media, this number is now thought to be closer to four.
Putting Kevin Bacon to one side, scientific knowledge can also be represented as relationships between things.
This could be drugs treating diseases, pairs of interacting proteins, phenotypes linked to genes.
Thousands or millions of such relationships make a knowledge graph or network analysis. SciBite technology enables the extraction of these relationships, and in doing so, can uncover the knowledge that might otherwise have remained hidden.
Knowledge Graphs for Pharmaceutical R&D
Let’s start with an example of a drug, Alosetron Hydrochloride, which was withdrawn in 2000 due to side effects including severe constipation and ischaemic colitis.
A researcher would want to find out more about the mechanisms of reported adverse effects to better understand the science behind a reported event.
SciBite provides a range of tools to efficiently explore such mechanisms through a number of approaches.
At a glance, DOCstore shows the Genes/Proteins most strongly associated with Alosetron:
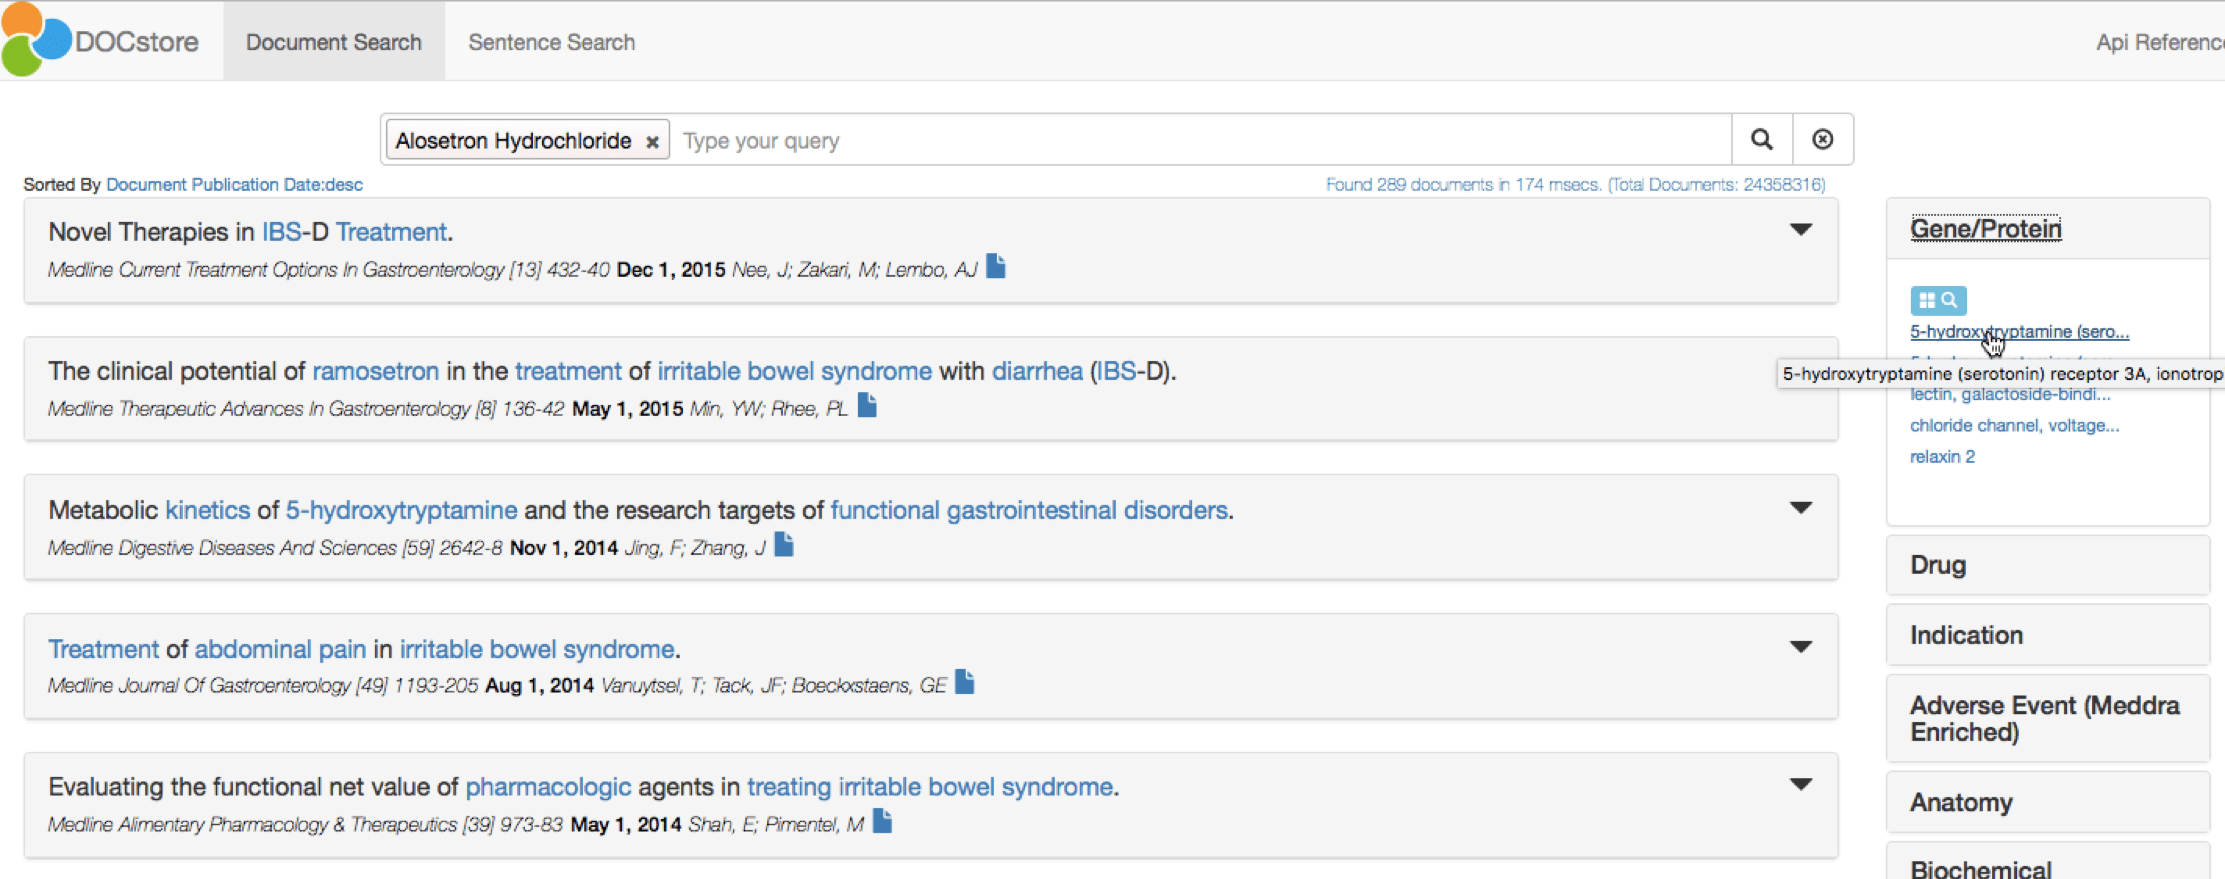
The top target is the 5-HT3 receptor, as displayed in the right-hand pane. A single click to add this to the DOCstore query confirms Alosetron as an antagonist for this target. The DOCstore navigation panel also clearly highlights the major adverse events discussed in papers about Alosetron and 5-HT3:
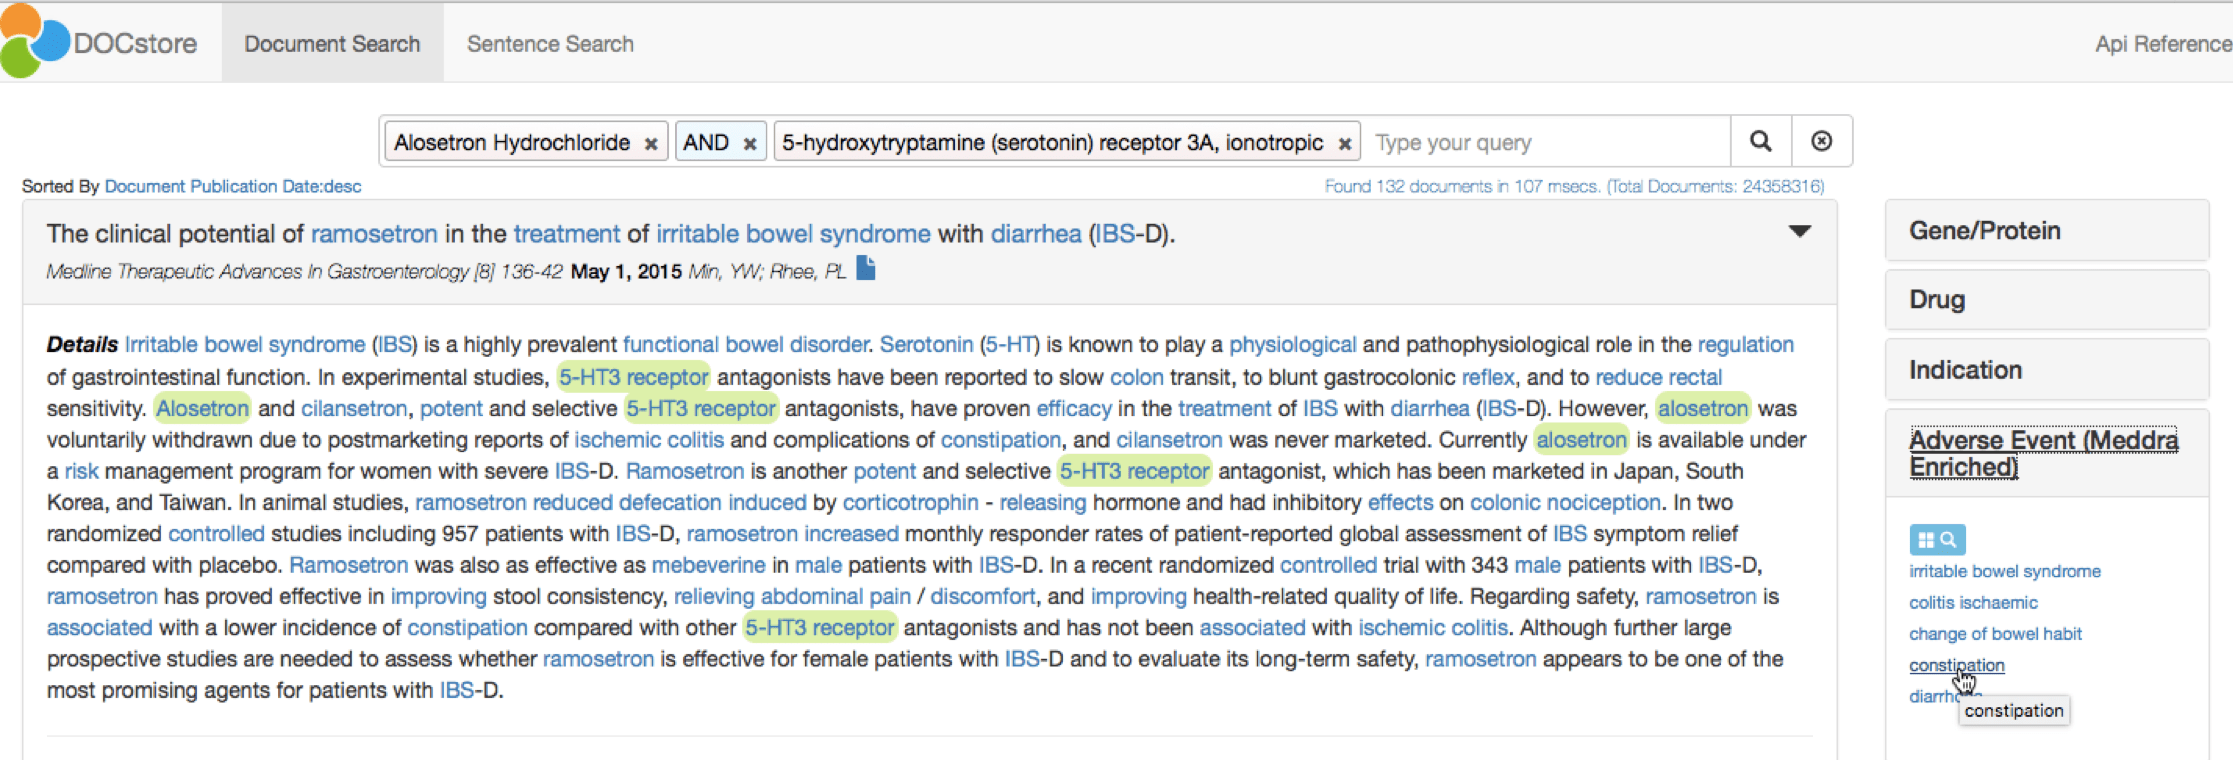
These relationships can also be described as triples as follows:
- DRUG: Alosetron -> treats -> INDICATION: Irritable Bowel Syndrome
- DRUG: Alosetron -> inhibits -> PROTEIN: 5-HT3
- PROTEIN: 5-HT3 -> is frequently mentioned with -> ADVERSE EVENT: Constipation
Once we have a set of triples we can start building knowledge graphs, constructed as computer-readable Subject -> Predicate -> Object relationships. Imagine this, not for a handful of entities relating to a single drug, but for many types of entities extracted from >22 million MEDLINE abstracts or for the entire Clinical Trials.gov database.
SciBite’s best in class named entity recognition capabilities can help you extract relationships from millions of unstructured documents coming from multiple sources.
A bad hair day
For the scope of this blog post, a graph is defined as a network of related entities. Within a graph, an entity such as a drug, a protein or an indication is called a node, the relationships between these are edges.
This is a graph:
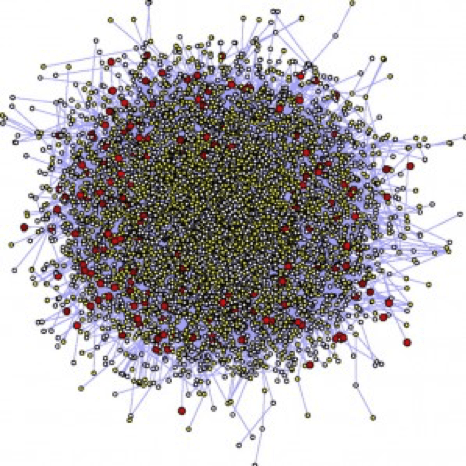
So is this:
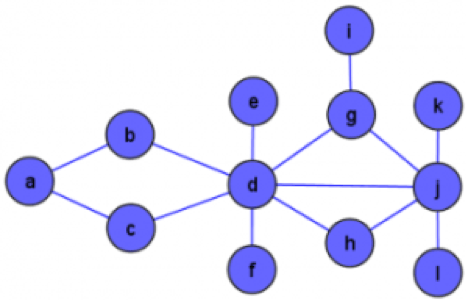
A big challenge with network visualisation is avoiding what is known as a “hairball” (graph 2), but gaining richer insights as might be available from the simple graph 1.
To reduce the impact of the hairball effect, SciBite provides a measure of relevance for each relationship based on each entity’s importance in the text and also enables statistics to be applied to filter out the real relationships from the noise.
We also partner with Linkurious, whose Linkurious Enterprise software helps companies search, explore and visualize connected data. Linkurious Enterprise is compatible with popular graph databases like Neo4j and Titan. It is used by some of the leading drug companies and medical research institutions.
Use cases
All the following screenshots are from Linkurious visualisations connected to a Neo4j database. The graph database was populated with entities and relationships extracted from unstructured text using TERMite.
Linkurious allows the user to interactively build up a graph view starting from a single entity or query. Because the user can start from a clean sheet and build the graph from the bottom up, it helps build a picture of only the things you are interested in and avoid those nasty hairballs.
- Example 1: Analysis of clinical trials in the area of Major Depressive Disorder (MDD)
This overview shows Drugs and Adverse Events in MDD trials that are mentioned in conjunction with the Serotonin transporter, SLC6A4. The user can browse the graph an expand nodes of interest or hide those which are less interesting. Relationships are tagged with metadata, such as relevance score, source, co-occurrence count.


Click on image to view a larger, knowledge graph
To explore adverse event in more detail, the user can zoom in to specific areas of the graph. In this case, the view is of drugs and targets in the context of Urinary tract disorder as a serious adverse event reported in MDD trials.
- Example 2: Analysis of rare disorders connected to Crohn’s disease
The following graph shows an overview of rare disorders (Yellow) with significant co-occurrence relationships to Crohn’s disease, extracted from Medline. Human Phenotypes (Pink) for each disorder were then mined from Orphanet text summaries. The graph layout below helps to identify those disorders with most phenotypes in common.
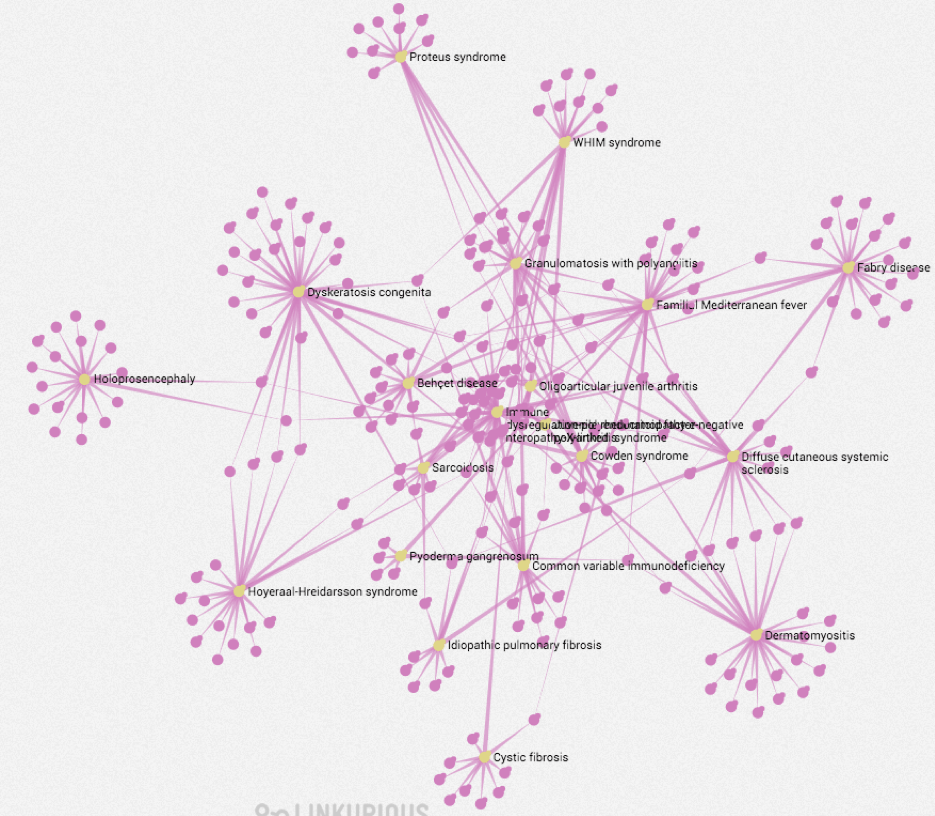
Focus view to help understand the mechanisms behind the phenotypes. Taking Familial Mediterranean Fever as an example from the graph above, we can see how it links to various phenotypes (Pink) via direct cooccurrence and also via relevant proteins (Green).

Further Reading
Business Intelligence for Graph Data: Linkurious product page
Connected Data Brings New Possibilities: Neo4j use cases
Related articles
-
The Relationship Game – Knowledge Graphs
Scientific knowledge can be represented as relationships between things. Thousands or millions of such relationships make a knowledge graph or network analysis. SciBite technology enables extraction of these relationships, and in doing so, can uncover knowledge that might otherwise have remained hidden
Read -

Addressing common challenges with Knowledge Graphs


In this blog we describe the pivotal role of semantic enrichment in the creation of effective Knowledge Graphs, and illustrate how semantic Knowledge Graphs help answer complex scientific questions.
Read
How could the SciBite semantic platform help you?
Get in touch with us to find out how we can transform your data
© Copyright © 2024 Elsevier Ltd., its licensors, and contributors. All rights are reserved, including those for text and data mining, AI training, and similar technologies.